
Monitoring & debugging
Every deployment has a dashboard with the three signals you reach for when something is off — usage charts, log output, and the underlying cluster events.
Metrics#
The Metric tab plots CPU, memory, request rate, and egress for the deployment. Both usage and allocated (request) lines are shown — the gap between them tells you whether you’re under- or over-provisioned. The time-range selector spans 1 hour aggregate, 1 day, 7 days, and 30 days.
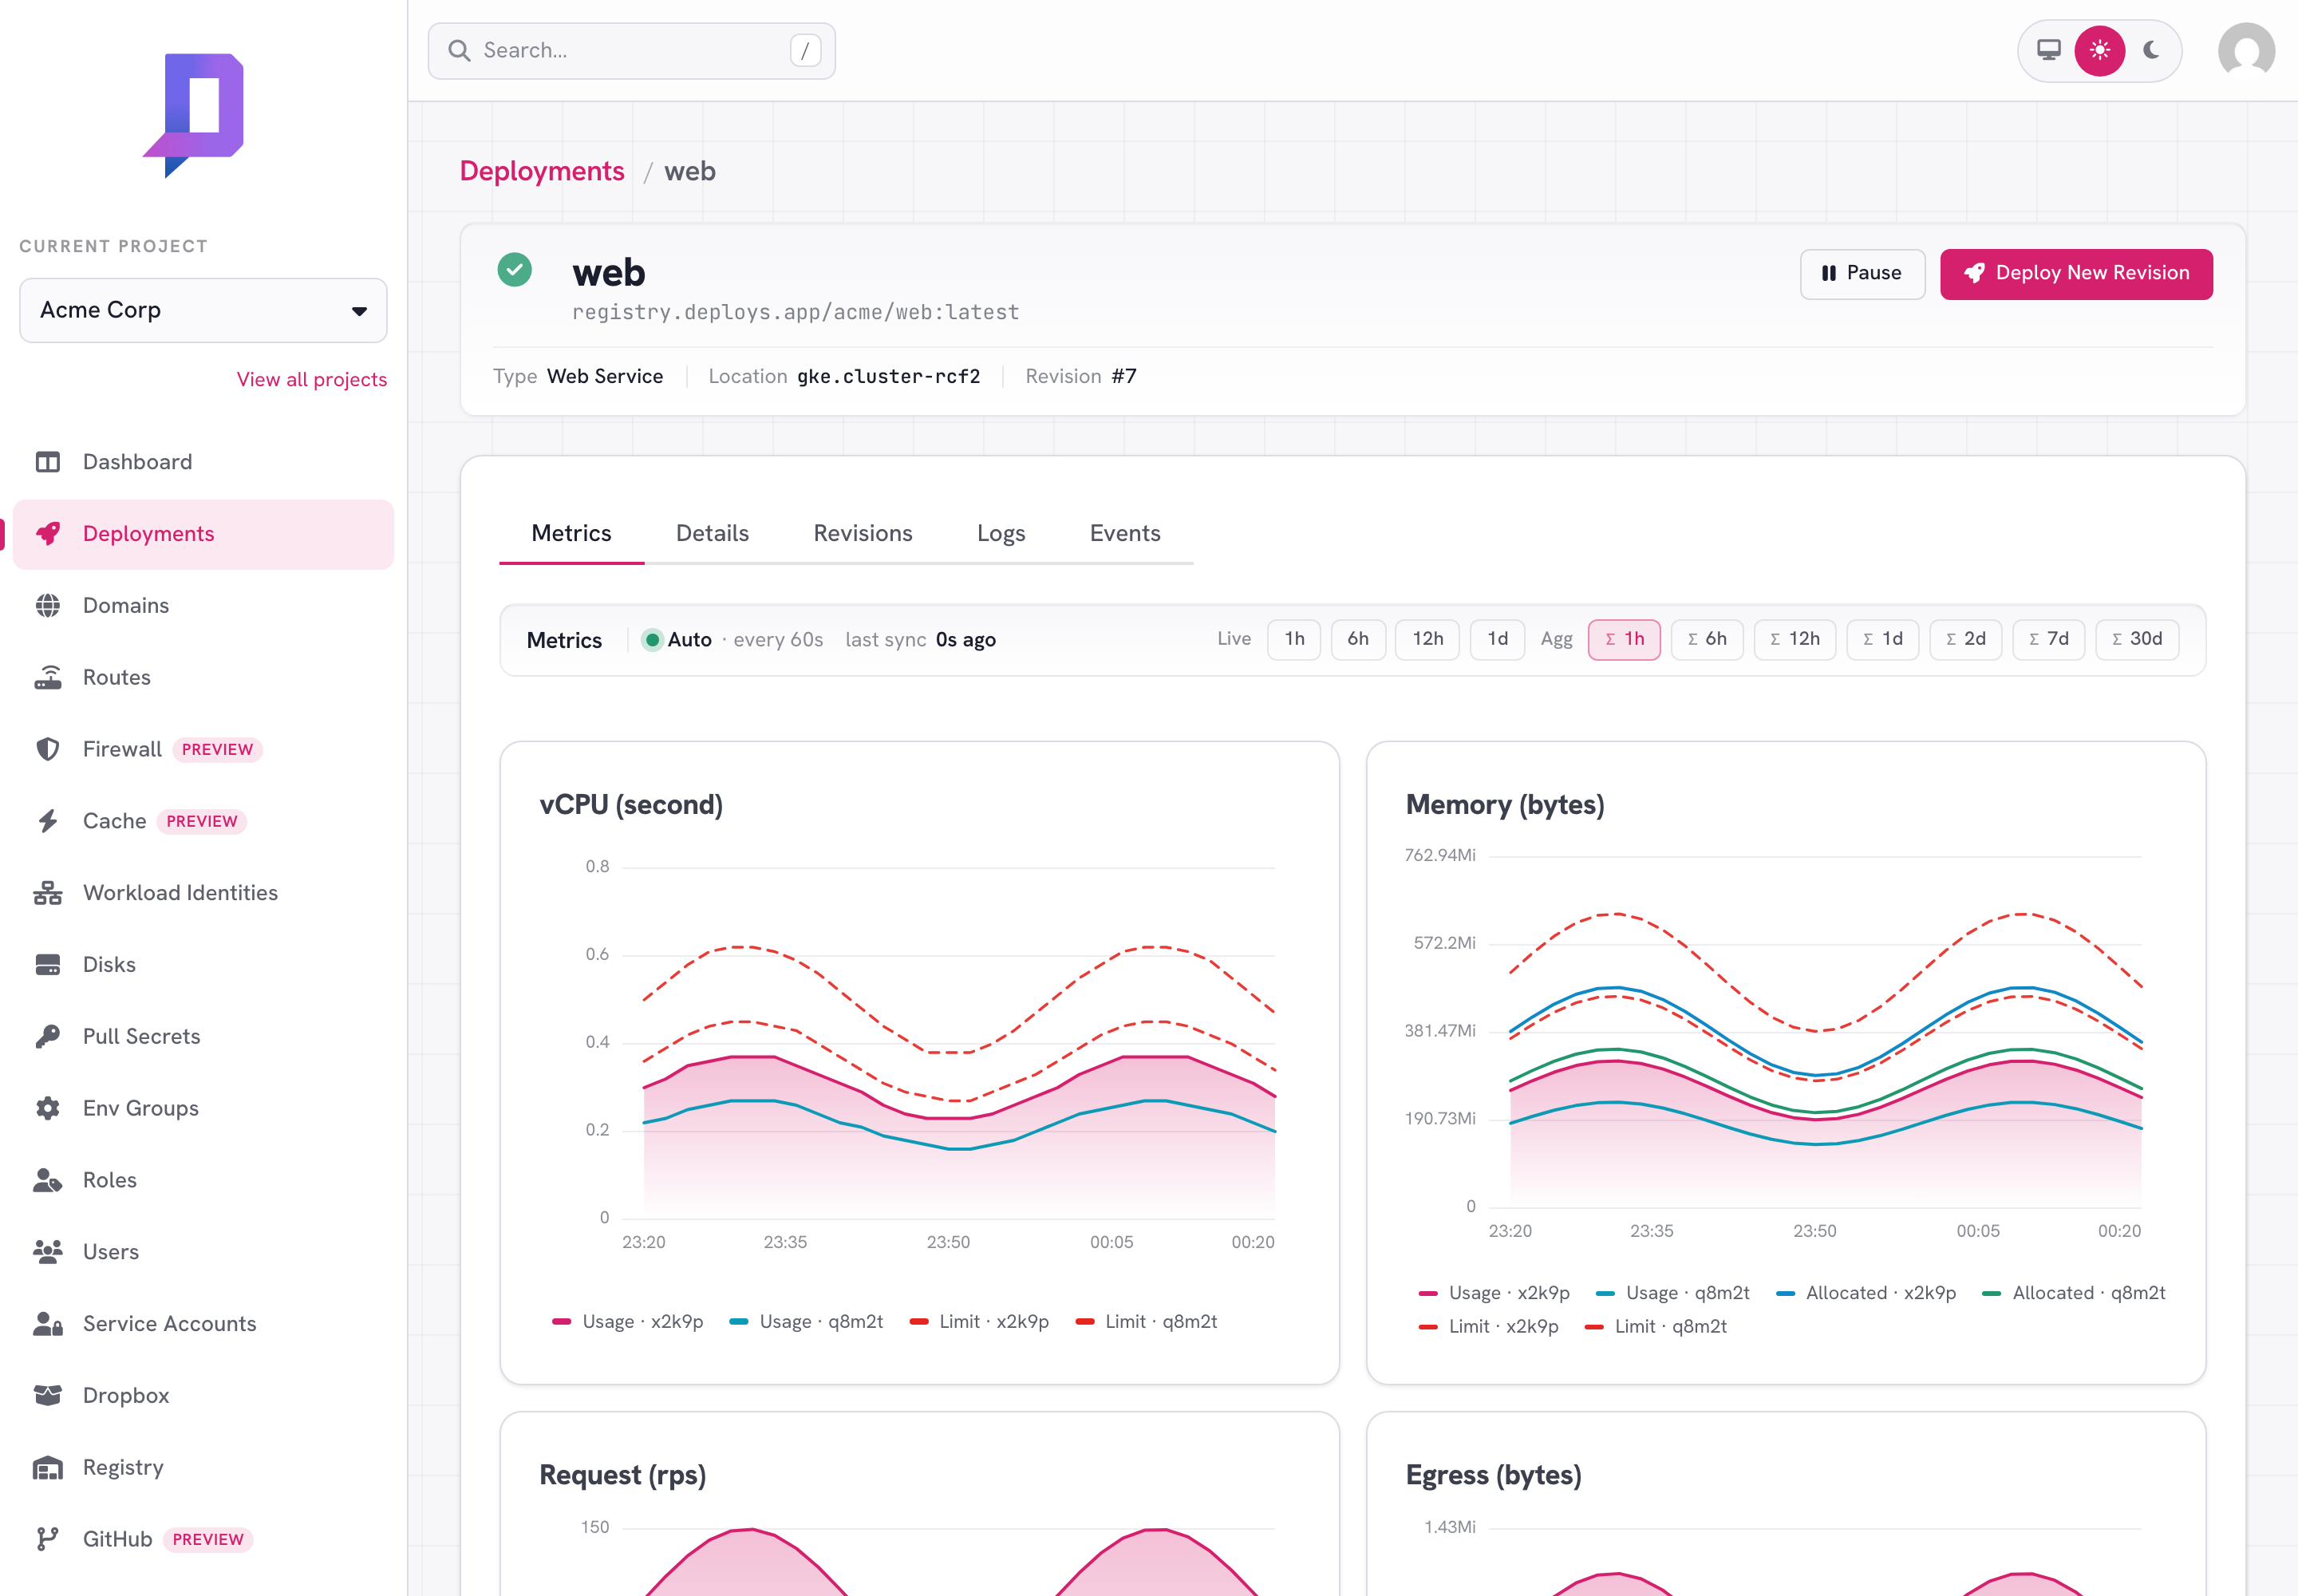
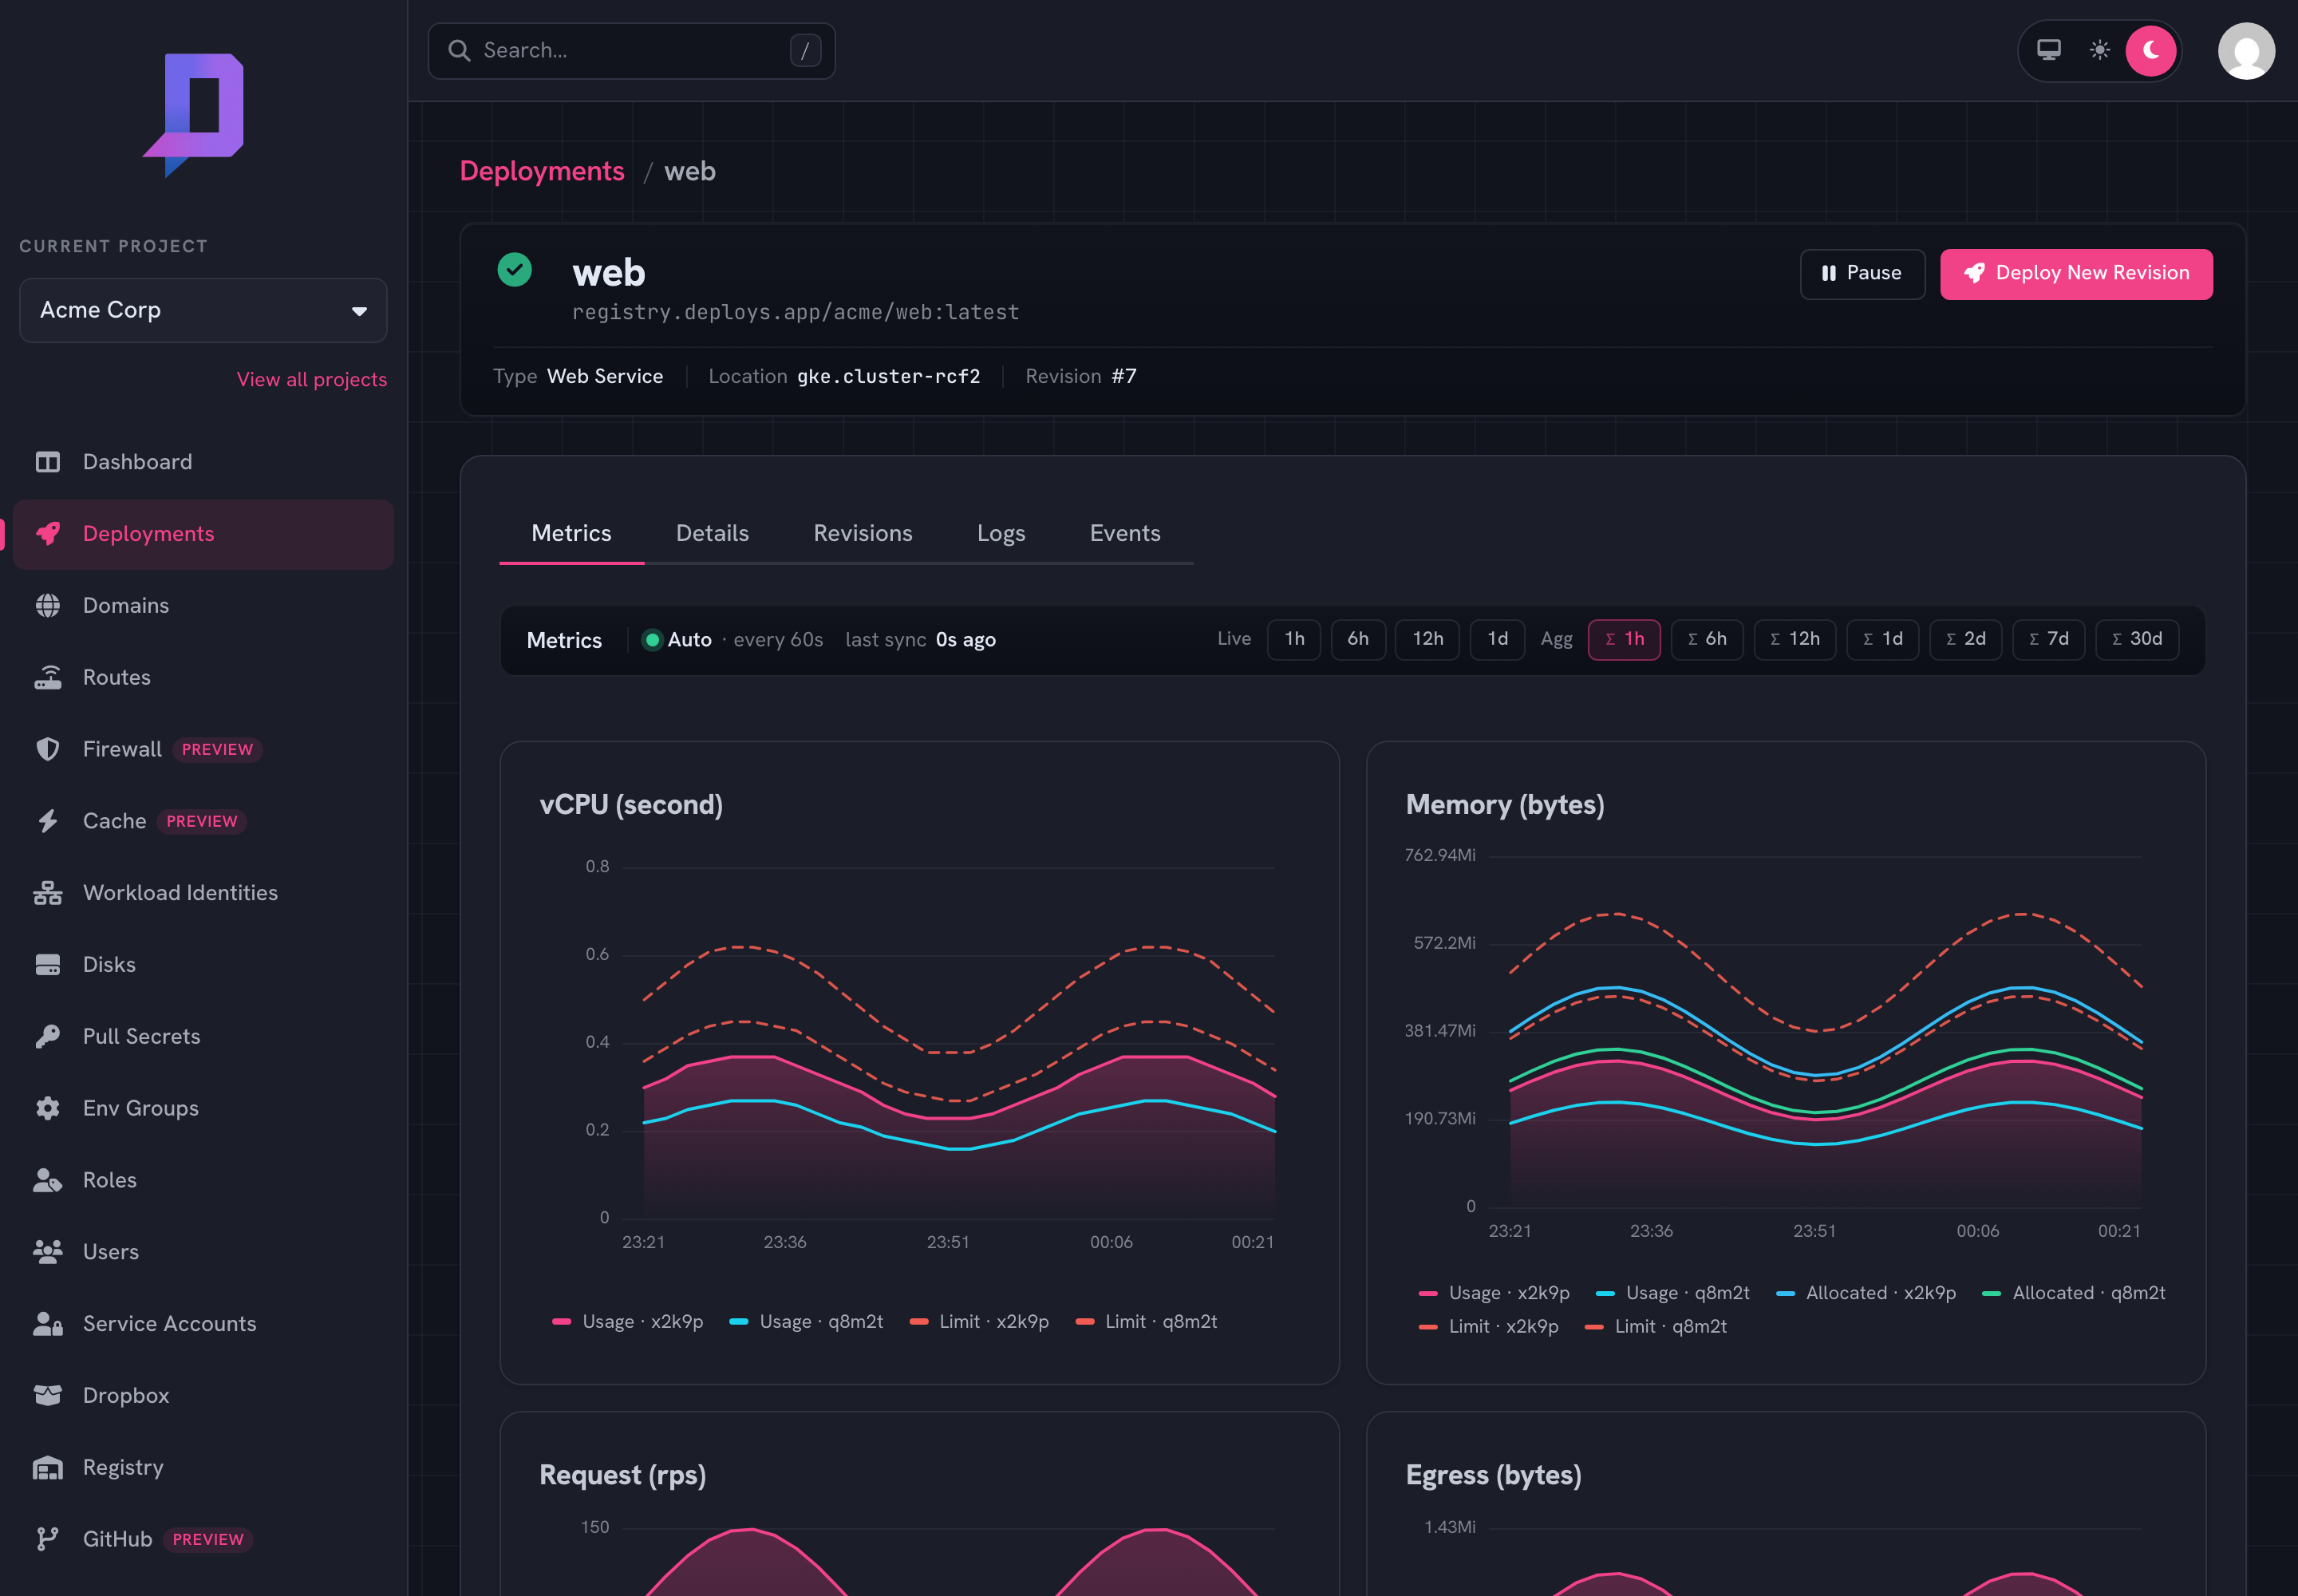
Metrics are also available from the API as time-series:
curl https://api.deploys.app/deployment.metrics \
  -H "Authorization: Bearer $DEPLOYS_TOKEN" \
  -d '{ "project": "acme", "location": "gke.cluster-rcf2",
        "name": "web", "timeRange": "1d" }'
The response is a set of named series, one per metric, each a list of
[unixSeconds, value] points.
Logs#
The Logs tab streams the deployment’s stdout and stderr. Hit Stream Raw
Logs to switch to a continuous follower (the default view is bounded to
the recent buffer). All replicas are interleaved — each line is prefixed with
its pod name so you can tell them apart.
Things to know:
- Logs are not retained indefinitely. Persist anything you care about long-term by shipping it to your own log aggregator (the platform doesn’t ingest them for you).
- High-volume log output (thousands of lines per second) can be sampled. Keep log lines short; bury big payloads in your aggregator instead.
- Stack traces in your output are also mined into grouped, deduplicated issues — see application error detection.
Kubernetes events#
The Events tab shows the cluster events behind the deployment — image-pull failures, OOM-kills, scheduling delays, readiness check fails. This is the first place to look when a deploy gets stuck “Pending.”
Common patterns:
ImagePullBackOff— the image isn’t reachable. Check the image name and digest, and confirm the pull secret if it’s a private registry.OOMKilled— your container exceeded its memory limit. Raiseresources.limits.memoryor fix the leak.Insufficient cpu/Insufficient memory— the cluster can’t schedule the requested resources right now. Lower the request or pick a different location.
What runs where#
Everything you see in the dashboard is computed from data the platform collects passively — there’s nothing to instrument inside your container.
| Signal | Source |
|---|---|
| CPU / memory usage | Pod cgroups, scraped at 60 s intervals |
| Request rate / egress | The ingress and routing layer |
| Logs | Container stdout / stderr, streamed via the events channel |
| Events | Native Kubernetes events for the deployment’s pods |
Alerting#
The platform doesn’t ship its own alerting. The recommended pattern is to
poll deployment.metrics from your own monitoring system (Grafana,
Datadog, Honeycomb, …) and define alerts there — usage data is the same
underlying time-series the dashboard reads.
A small service account with read-only permissions is the right principal for this:
deploys role create --project acme --role metrics-reader \
  --permissions deployment.list,deployment.get,deployment.metrics
Bind it to your monitoring service account and use the credentials in your exporter.
Reading logs and status programmatically#
The dashboard tabs are for humans. An agent, script, or CI job reads the same signals through the API, MCP, and CLI with actions that return once — no open stream to consume:
deployment.status— structured pod health in one call: thecount/ready/succeeded/failedtally plus, for every non-ready pod, its raw failure reason (waitingReason,terminatedReason,restartCount,exitCode,lastTerminatedReason). This is how you answer “is it healthy, and if not, why” without scraping events.deployment.logs— a bounded snapshot of recent container output.tailLinesdefaults to 200 and is clamped to[1, 1000]per pod; the response is additionally capped at a committed 256 KiB byte budget (oldest lines dropped,cappedByBytesset) so a verbose multi-pod deployment can’t blow your context window. Setprevious: trueto read the last crashed container — the panic or stack trace behind aCrashLoopBackOfflives there. This reads live, ephemeral pod output.deployment.logsHistory— the durable sibling ofdeployment.logs. It reads back a 30-day history of captured log output over asince/untilwindow, so it survives the pod garbage-collection and full teardowns that leave live logs with nothing to read. Lines come back oldest-first (forward) by default, or newest-first withreverse: true; page forward or back through a large window with the opaquecursor(the result returns anextCursoruntil the window is exhausted), and bound a page withlimit. As withdeployment.logs, a page is byte-budget capped —cappedByBytesflags a truncated page. Passpodto narrow to a single replica. History lags live output by the capture flush interval — it’s best-effort, not real-time, so the freshest lines may not have landed yet; reach fordeployment.logswhen you need the current tail. It’s available only for locations configured with a log bucket; locations without one have no history to read.
# why is it unhealthy?
deploys deployment status --project acme --location gke.cluster-rcf2 --name web

# the crash post-mortem (previous container) — live and ephemeral — as JSON
deploys deployment logs --project acme --location gke.cluster-rcf2 --name web \
  --previous --tail 200 -o json

# durable 30-day history, oldest-first, over the last 24 hours
deploys deployment logs-history --project acme --location gke.cluster-rcf2 \
  --name web --since 24h

# the same window, newest-first
deploys deployment logs-history --project acme --location gke.cluster-rcf2 \
  --name web --since 24h --reverse
--follow on the CLI re-polls the deployment.logs snapshot for you; the API
and MCP contracts stay snapshot-only (one call, one bounded result).
deployment.logsHistory is a windowed read rather than a tail — page it with
cursor instead of following it.
deployment.logs reads live pod logs, which are ephemeral — they’re gone
once a pod is garbage-collected, and previous only survives until then. A
deployment that crashed and was fully torn down leaves nothing for it to read.
For the durable signal, reach for deployment.logsHistory (the 30-day captured
history, where the log bucket is configured) or deployment.status’s
lastTerminatedReason / exitCode. deployment.logs itself is not a
historical log store.Permissions#
The split is deliberate, because raw stdout can contain secrets while pod
status cannot:
deployment.statusis authorized by the ordinarydeployment.getpermission — the same read used fordeployment.getanddeployment.metrics.deployment.logsrequires its own dedicateddeployment.logspermission, which is not public-bindable. Grant config/status reads without granting log reads.deployment.logsHistoryreuses that samedeployment.logspermission — the durable history carries the same secret-bearingstdout, so it’s gated exactly like the live read. Grantingdeployment.logscovers both.
A localhost agent can mint a read-only, short-lived token scoped to exactly
these two permissions with me.generateToken (it accepts
deployment.get and deployment.logs), so an observability credential never
carries write access.
React to failures without polling#
deployment.status and deployment.logs tell you what’s wrong — but an agent
still has to know when to look. Polling a deployment on a timer wastes calls and
adds latency. The
notification side closes the loop: the
platform emits a deployment.health failure
event the instant a deployment fails asynchronously (a crash-loop the auto-error
reconcile tears down, or a deployer apply failure), so you read failure detail
only at the moment it happens.
A localhost agent runs the whole observe→diagnose→fix loop over shipped contracts, no public URL and no polling:
- Mint a scoped token.
me.generateTokenwithnotification.create/notification.pull/notification.delete+deployment.get+deployment.logs. - Subscribe a pull channel.
notification.createtypepull,subscription: { events: ["deployment.health", "deployment.deploy"], outcomes: ["failure"] }. Apullchannel needs no inbound endpoint — you fetch from it. - Loop
notification.pull. On adeployment.healthfailure event:deployment.status→ confirm the structured per-pod reason,deployment.logs(previous: trueif it’sCrashLoopBackOff) → the panic / stack trace,- decide:
deployment.rollback, or redeploy with a fix.
- Recovery arrives on the same stream. Your fix’s
deployment.deploysuccess event flows through the same channel — that’s the “it’s healthy again” signal, no separate event needed.notification.deleteon exit (an inactivity reaper cleans up if the agent crashes).
# subscribe once
deploys notification create --project acme --name agent-loop --type pull \
  --event deployment.health --event deployment.deploy --outcome failure

# then long-poll for the next failure (--follow re-polls for you)
deploys notification pull --project acme --name agent-loop --follow
The same deployment.health event also drives push channels (webhook, Discord)
for humans — see notification channels.